Can we detect the effects of racial violence on patenting? Reanalyzing Cook (2014)
Introduction
Cook (2014) (original code, my code) studies the effect of racial violence on innovation by Black Americans over 1870-1940. This paper has been described as ‘seminal’ (here and here), discussed in the media (here and here), and continues to be cited in the literature. For example, Albright et al. (2022) cites the paper with this description: “Cook (2014) studies the effects of race riots and lynchings between 1870 and 1940 and finds that these forms of violence and insecurity reduced patenting by Black people by more than 15% annually from 1882-1940.” In this article I use the original data and code from Cook (2014) to show that the results do not justify such a precise quantitative summary. The time series results are not robust to using a more complete patent variable and are not consistent with the timing of patent applications and grants, and the panel data results are based on a dataset where most observations are missing. While the broad conclusions from Cook (2014) may be true, they are not supported by the evidence in the paper.
Data irregularities
Cook has two measures of patents per year: (1) using the year the patent was applied for, and (2) using the year the patent was granted.1 In the paper, Figure 1 reports Black patents per million using grant-year, while Figure 2 shows Black patents per million using application-year. Comparing the two graphs, we see that the scale differs by a factor of about 10.2 I discovered that this discrepancy is explained by Cook dividing Black grant-year patents by the white population to calculate patents per million.3 I correct the grant-year variable by recovering the raw patent counts and dividing by the Black population. As we can see in Figure 1, the original time series variable is much smaller than the corrected variable, due to dividing by the larger white population.
Figure 1

Note: Time series is the original grant-year patent variable used in Table 6, which divides by the white population. Time series (fixed) corrects this variable by dividing by the Black population. Panel is the aggregated panel data patent variable used in Table 7.
Moreover, by comparing the raw counts with the panel data used in Table 7, I found that there are 672 patents in the time series data, and 702 patents in the panel data.4 I aggregate the panel data patents by year and plot them in Figure 1. We can see that the corrected time series variable and the panel data variable are identical up to 1896, after which they diverge. One possible explanation is that Cook revised the patent variable by adding more patents, but updated only the panel data variable and not the time series variable. Below I test whether the time series regressions are robust to using the aggregated panel data patent variable.
Time series regressions
Cook uses grant-year patents as the dependent variable for the main results in Tables 6-8, and does not directly use application-year patents.5 However, we can use the timing of applications and grants to perform a more nuanced test of Cook’s hypothesis that racial violence deters innovation by Black inventors. Cook reports that the average time gap between application and grant is 1.4 years. If violence in year T deters inventing, we should observe: (1) a decrease in patent applications in the same year; (2) no effect on year T grants, since the applications for those patents were made in year T-1; (3) a decrease in grants in year T+1, as grants lag applications by roughly one year. Racial violence could also affect contemporaneous grants by influencing patent office behavior; I discuss this possibility below.
To test these predictions, in Table 1 I repeat the Table 6, Column 3 regression using Black patent applications and grants.6 I use the three versions of the grant variable from Figure 1: the original time series variable that divided by the white population, the corrected variable using the Black population, and the aggregated panel data variable. Since the application-year variable is missing in 1940, I omit that year from all regressions, leading to slightly different grant-year results compared to the original (which has N=56). Column 1 presents the contemporaneous effect of violence on applications. The first prediction is falsified, with no relationship between racial violence and patent applications. Column 2 replicates the original result from Table 6, Column 3. The estimates are very similar to the original paper, with lynchings and riots negatively correlated with contemporaneous grants.7 However, the model predicts no correlation between violence and grants in the same year. The coefficients in Column 3 are nearly identical to Column 2, demonstrating that normalizing by the white or Black population does not have a big effect. In contrast, when using the panel data variable in Column 4, the correlations are much smaller and nonsignificant, which is consistent with the second prediction.
Columns 5-7 test for a lagged effect of violence on grants. Against the model’s prediction of a negative effect, riots in the previous year are positively correlated with patent grants for all three variables. The coefficient on lagged lynchings is positive for the two time series grant variables (Columns 5 and 6), but the correlation is nonsignificant. Thus, the first and third predictions of the model are falsified. The second prediction holds when using the panel data grant variable, which seems more appropriate, as it has 30 more patents. Overall, these results cast doubt on the main finding in Cook (2014).
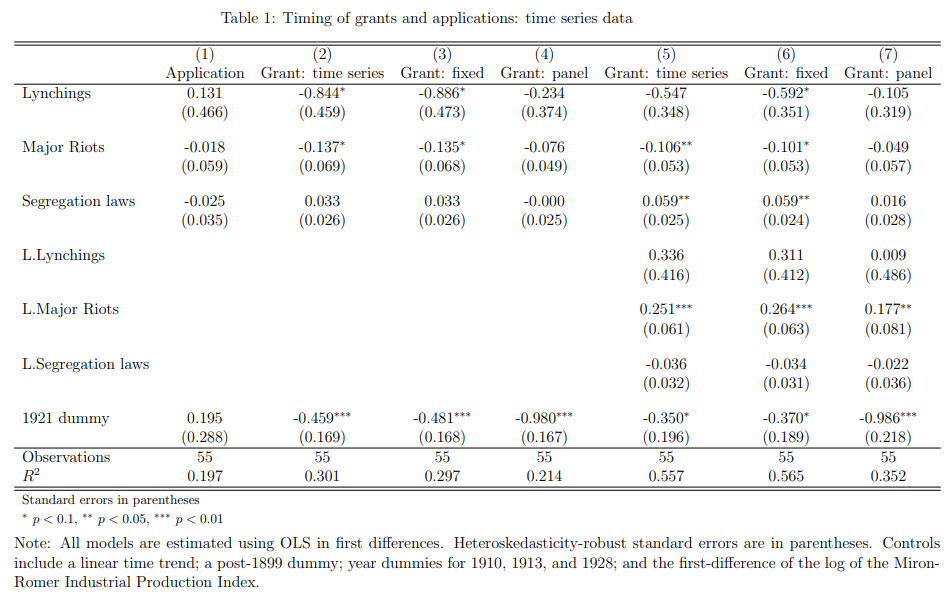
An alternative model is that racial violence affects the behavior of the patent office, instead of influencing individual inventors. Patent examiners may have delayed the granting of Black patents during years with high racial violence, to avoid becoming a target themselves. This explanation is consistent with the effect on grants being negative for contemporaneous violence and positive for lagged violence. However, this model faces several problems. First, if the panel data variable is preferred, then there is no negative effect on contemporaneous grants.8 Second, as Cook notes (p.226, fn.15), the time gap between application and grant was the same for white and Black inventors. If patent offices were delaying grants for Black inventors, the time gap should differ by race. Third, since race is not listed on the patent, examiners may not have been able to apply discretion by race.
In Table 6, Cook includes a dummy variable for 1921 to capture the effect of the Tulsa Race Riot on patenting. However, using patent applications above in Column 1 of Table 1, the coefficient on the 1921 dummy is positive, when we would predict that racial violence directly deters inventing and patent applications. To investigate this result further, in Table 2 I include two year dummies on either side of 1921, for both patent applications and grants. In Column 1, I find that applications were higher in 1919 and lower in 1920. Columns 2-4 show that grants were higher in 1919, 1920, and 1922, and lower in 1921. Since grants lag applications by roughly one year, a natural explanation is that applications are correlated with grants in the following year. That is, high applications in 1919 correspond to high grants in 1920, and low applications in 1920 correspond to low grants in 1921. So it would appear that the negative effect on patent grants in 1921 is explained by fluctuations in applications, rather than being caused by the Tulsa Race Riot.9

Panel data regressions
In Tables 7 and 8, Cook uses state-level panel data over 1870-1940 to run regressions of patents on lynchings, riots, and segregation laws. However, we can see that the panel is unbalanced: there are 49 states and 71 years in the data, but only N=430 observations. A complete, balanced panel would have 3210 observations, as the number of states grows from 38 in 1870 to 49 in 1940 (including DC; see code for details). So Cook is using 430/3210 = 13% of the full sample.
Figure 2a: Observations by state
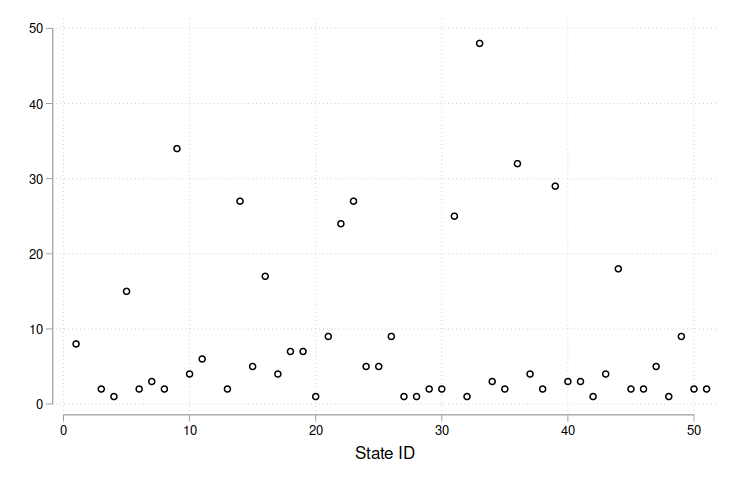
Figure 2b: Observations by year
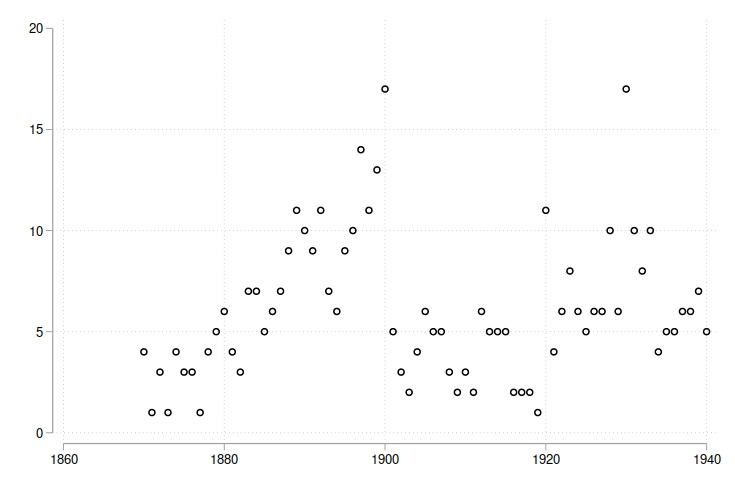
And the pattern of missing data is not random. In Figure 2 I plot the number of observations by state and year. First, in Fig. 2a we see that the majority of states have fewer than 10 observations over 71 years. Next, in Fig. 2b the sample size is increasing up to 1900 before dropping off and rising again starting in 1920. Decomposing by region, Appendix Fig. 3 shows that the Midwest and Mid-Atlantic regions are relatively overrepresented, while the South and West are relatively underrepresented.
Moreover, consider how this unbalanced panel compares to the full time series. There are 35 riots in the time series data, but only 5 in the panel data (for 14% coverage). There are 290 new segregation laws in the time series data, but only 19 in the panel data (for 7% coverage).10 We cannot say whether the same problem applies to the lynchings variable, since the replication files do not have raw count data.
What explains the missing data? One possibility is that Cook dropped any state-year observation that had a variable with a missing value, since the actual data has no variables with missing values, but many missing state-year observations. Another explanation is that Cook did not collect complete data on observations with zero patents. There are 24 observations with patent=0, corresponding to twelve states, each with exactly two observations in the sample: one in 1900 and one in 1930. It appears that Cook collected data on zero-patent states only in 1900 and 1930.
With this low level of data coverage, it is unclear how to interpret the results in Tables 7 and 8. It is possible that the estimates are unbiased, and would remain stable as the missing data was filled in. Especially considering the high prior probability that racial violence and patents are negatively correlated, we should place some weight on this. But when working with small effects and noisy data, statistically significant results are expected (Gelman and Carlin, 2014). So it is also possible that the results are false positives.
Aside from the missing data problem, the issue of application and grant timing also arises with the panel data. As before, racial violence should affect patent applications in the same year, and grants in the following year (given the one-year lag between applications and grants). Cook has different data files for applications and grants, and of the three violence variables, only the riots variable is similar across datasets.11
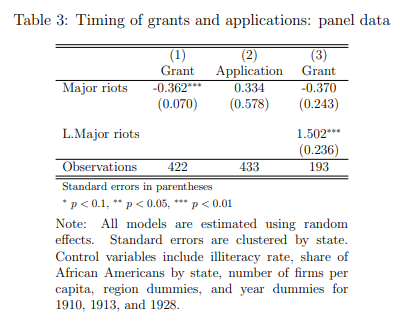
Hence, in Table 3 I regress patent grants and applications on contemporaneous and lagged riots (omitting lynchings and segregation laws).12 As with the time series data, the deterrence model is not supported by the data. Grants are negatively correlated with violence in the same year, while applications are not (Columns 1 and 2). In Column 3, we again see that lagged riots are positively correlated with patent grants, even though the sample size is half as large because of the unbalanced panel. However, there are only two riots in the estimation sample, which makes noisy data the most plausible explanation for the positive effect in both datasets.
Conclusion
To summarize, the main time series result in Cook (2014) is not robust to using a more complete patent variable and is not consistent with the timing of patent applications and grants, and the panel data results are questionable because of missing data. Nonetheless, the conclusions remain plausible, because they have a high prior probability. Lynchings, race riots, and segregation laws were a severe problem, and it would be astonishing if they did not have pervasive effects on the lives of Black people.
But with the data available, it is unrealistic to think we can statistically detect causal effects. Credible causal inference would require more complete data as well as an identification strategy more convincing than regression with controls. Descriptive analysis is the most that this dataset can support, and is a valuable contribution in itself, along with the rich qualitative and historical evidence in the paper. Cook deserves credit for pursuing this important research question and putting in years of effort to collect the patent data.
And in fact, recent research, no doubt inspired by Cook, does report findings that are consistent with Cook’s claims: Williams (2022) shows that historical lynchings reduce contemporary Black voter registration13; Albright et al. (2022) studies the Tulsa Race Massacre, and finds that it had persistent negative effects on Black Americans; and Aneja and Xu (2021) shows that Woodrow Wilson’s segregation of the federal government increased racial inequality. Future research should continue in Cook’s footsteps and bring attention to the consequences of America’s racist history.
Appendix
Fig 3: Observations by region

Note: Number of states by region: South 15, Midwest 12, Northeast 6, West 12, Mid-Atlantic 7. Eleven states enter after 1870, and hence have fewer than 71 years in the complete panel. See code for details.
Reproducibility issues
In terms of computational reproducibility, Cook’s code has several problems:
-
The code for Figures 1, 2, and 3 is in Stata graph editor format, which cannot be run from a do-file.
-
Figure 1 uses the variable
patgrntpc, patents by grant-year per capita, but the graph refers to patents per million. Similarly, Table 5 reports ‘Patents, per million,’ but the code usespatgrntpc. The variable should be named ‘patents by grant-year per million.’ -
There is no code for Table 4.
-
Equation 1 and Table 6 refer to patents per capita, but the variable in the code,
patgrntpc, has mean values of 0.16 for Blacks and 425 for whites; this is patents per million, not per capita. -
The text says that the dependent variable used in Table 6 is “patents per capita applied for in year t and granted to individuals of race i” (p.235). However, the code uses grant-year patents, i.e., patents granted in year t. Application-year patents are used in Table 9.
-
The code for Table 6 refers to a variable
LMRindex, but the dataset containsDLMRindex. -
Section 3.2 mentions that the state-level regressions use data over 1882-1940, but the code uses data over 1870-1940.
-
The code for Table 7 includes a command to collapse the data down to the state-year level, but the data is already in a state-year panel.
-
The code for Table 7 uses a variable,
estbnumpc, for the number of firms per capita, but it is not included in the dataset. -
The code for Column 1 in Table 7 includes the ‘number of firms’ variable, but the paper only includes it in columns 3-6.
-
In the notes to Tables 7 and 8, Cook writes that “Standard errors robust to clustering on state and year are in parentheses.” However, the code only clusters by state, using
vce(cl stateno). -
The code for Table 8 has an error in its clustering command, using the incorrect syntax
vce(stateno)instead of the correctvce(cl stateno). -
The code for Table 8 does not exactly reproduce the results in the paper. When I run the code, I get N=429, while Cook’s regressions have N=428.
-
The code for Table 9 does not reproduce the results in the paper.
-
In the text, Cook says there are 714 patents used in Table 9, but the actual number is 712.
-
The data for Table 9 has different variables than the data for Table 7. The Table 9 data includes cumulative segregation laws, while the Table 7 data has annual segregation laws. The lynching variable is also different. For example, California has no lynchings in the Table 7 data, but nonzero lynchings in every year in the Table 9 data.
Data errors
There are several data errors:
-
State 9 has the South dummy equal to 1 for all years, but also has the Mid-Atlantic dummy equal to 0.33 in 1888.
-
State 14 has the Midwest dummy equal to 1 in all years except 1886, when both it and the South dummy are 0.5.
-
State 31 in 1909 has a value of 0.33 for ‘number of new segregation laws,’ which should be integer-valued.
Footnotes
-
There is no data on unsuccessful applications. ↩
-
Cook did not respond to any emails about the paper. ↩
-
When I multiply the original patent rate by the white population (interpolated by constant imputation), I obtain integer values, i.e., the raw patent counts. Hence, we can infer that Cook used constant imputation to fill in missing values of the decennial population data. For the application-year variable, Cook used the Black population and exponential interpolation. These data cleaning procedures are not discussed in the text or code. ↩
-
Cook reports collecting data on 726 patents. It is not clear why the totals in the replication files are lower. ↩
-
Table 9 uses application-year data to match Black and white patents, then aggregates over time. ↩
-
Since the main conclusions are for Black inventors, I focus on Column 3. Also, Cook’s replication package does not have application-year time series data for white patents. ↩
-
Cook’s Table 6 incorrectly shows the lynching estimates in Columns 2 and 3 as being significant at the 5% level, when the p-values are larger than 0.05. ↩
-
And if the time series variable is preferred, then we require an explanation for the positive effect of segregation laws in Columns 5 and 6. ↩
-
The higher level of grants and applications in 1919 is particularly puzzling, given that it is the year in the sample with the most riots (see Cook’s Fig. 2). ↩
-
The actual number is 19.33. Somehow, one state-year observation has a value of 0.33 for the number of new segregation laws. ↩
-
There are 5 riots in the estimation sample when using the grant data, and 4 riots when using the application data. The other two variables have different definitions. The application dataset uses cumulative segregation laws, while the grant dataset uses annual segregation laws. The lynchings variable is different across datasets, with no clear explanation. Moreover, the industry participation variable is only in the grant data, so I do not control for it (grants and applications mostly occur in different years, so the datasets cannot be merged). ↩
-
There are 425 observations in the original Table 7, Column 3 regression using grant-year patents. My Column 1 has 422 observations because I have to merge the ‘number of firms’ variable from the application data, which is missing years 1870-1872. It is not clear why there are more observations in Column 2 when using the application data. ↩
-
However, the results in Williams (2022) have been questioned by Haddad, Kattan, and Wochner (2023), who find that the effect is driven by four outlier counties. ↩
 Michael Wiebe
— built with Jekyll using Lagom theme
Michael Wiebe
— built with Jekyll using Lagom theme