Replicating the literature on prefecture-level meritocratic promotion in China
Introduction
China’s economy has grown spectacularly over the past three decades, averaging nearly double-digit GDP growth rates, and lifting hundreds of millions of people out of poverty. What can explain this phenomenon? Over the past few decades, a sizeable literature has emerged claiming that China uses promotion tournaments to incentivize economic growth. Officials at the same level (for example, prefecture mayors within the same province) compete with each other on the basis of relative GDP growth, and the winners are rewarded with promotion up the administrative hierarchy. This tournament competition generates strong incentives for politicians to boost growth, and hence provides an explanation for China’s incredible economic performance.
The seminal work in this literature is Li and Zhou (2005), which found a meritocratic effect for provincial leaders. This paper has been cited over 3400 times on Google Scholar, indicating that meritocratic promotion is a well-accepted idea. For example, in a review article in the Journal of Economic Literature, Brandt et al. (2014) write: “performance evaluation [...] assigned major weight to local GDP growth [...] these policies are widely viewed as having inspired tournament-like competition among county and provincial leaders, who [...] made strenuous efforts to ramp up local economies (Li and Zhou 2005).” Moreover, economic theorists also take the idea of meritocratic promotion as given, with at least four theory papers written in recent years (Chen et al., 2019; Li et al., 2019; Xiong, 2018; Wang and Zheng, 2020).
Despite this seeming consensus, there is serious debate over meritocracy for provincial leaders. Shih et al. (2012) contend that political connections are what determine promotion, rather than economic performance. In contrast, Jia et al. (2015) find that meritocracy exists, but only for connected leaders. Furthermore, Su et al. (2012) claim that the original result in Li and Zhou (2005) does not replicate after fixing data errors, while Sheng (2022) finds that meritocratic promotion was implemented only for provincial governors during the Jiang Zemin era (1990-2002). Hence, there is substantial uncertainty about whether provincial leaders are promoted meritocratically on the basis of GDP growth.
In this paper, I show that similar uncertainty holds for meritocratic promotion of prefecture leaders.1 Using the original data and code, I replicate three papers (published in the Journal of Economic Growth (Yao and Zhang, 2015), the Economic Journal (Li et al., 2019), and the Quarterly Journal of Economics (Chen and Kung, 2019)) that provide different settings to test for meritocratic promotion at the prefecture level. Appendix Table A1 presents a summary of the sample and methods used in each paper. While I am able to replicate the original results, I conduct a series of robustness exercises using alternative control variables, regression specifications, and outcome variables that ultimately cast doubt on the meritocracy hypothesis for prefecture leaders.
Yao and Zhang (2015)
Yao and Zhang (2015), published in the Journal of Economic Growth, was the first paper to study meritocratic promotion at the prefecture level in China, using data from 1998-2010. They apply a three-way fixed-effects model to leaders and cities, using leaders that move across cities to identify leader ability to boost GDP growth. The main contribution is identifying variation in leader ability, with secondary results on the effect of leader ability on promotion.
Leader effects are estimated in a three-way fixed-effect model, along with year and city fixed effects:
\[y_{ijt} = \beta X_{ijt} + \theta_{i} +\psi_{j} + \gamma_{t} + \epsilon_{ijt}.\]Here \(y_{ijt}\) is real GDP growth in city \(j\) in year \(t\), \(X_{ijt}\) is time-varying controls, \(\theta_{i}\) is leader \(i\)’s fixed effect, and \(\psi_{j}\) and \(\gamma_{t}\) are city and year fixed effects. When using the largest sample connected by movers, all three fixed effects can be identified in a regression of GDP growth on the fixed effects. Note that this paper pools prefecture mayors and secretaries, which allows for a larger maximal connected set.
The authors estimate the effect of leader ability on promotion in the following model:
\[p_{ijt} = \alpha \theta_{i} + \delta Z_{ijt} + \nu_{k} + \eta_{t} + u_{ijt}.\]Here \(p_{ijt}\) is either a dummy or a categorical variable, \(Z_{ijt}\) is control variables, and \(\nu_{k}\) and \(\eta_{t}\) are province and year fixed effects.
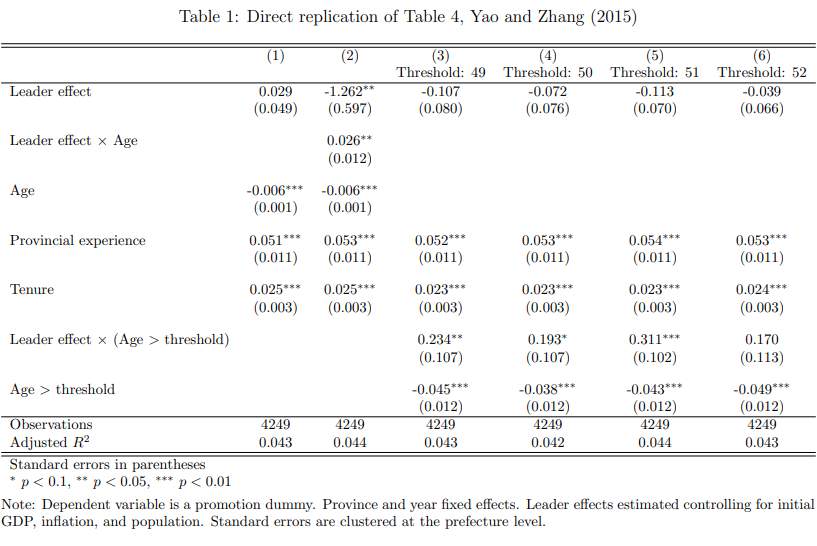
I directly replicate their Table 4 in Table 1 below; the original table is reproduced in Appendix Table A2.
I make a few changes to their code.
First, I cluster standard errors at the prefecture level; the original paper did not cluster.
Second, the original paper made a coding error in the \(Age > Threshold\) variable.
Specifically, the authors neglected the fact that Stata’s gen function treats missing observations as infinite, so observations with a missing age variable are coded as being above the threshold.
I correct this error, which reduces the sample size in Columns 3-6 to match that in Columns 1-2 (as the latter columns automatically exclude the missing observations).
Despite these changes, the results are almost identical.
For example, the original coefficient on \(\mbox{Leader effect} \times (\mbox{Age} > \mbox{Threshold})\) in Column 5 is 0.291 (0.102), while mine is 0.311 (0.102).
They find no average correlation between leader effects and promotion, in either the LPM or ordered probit models (Column 1 in Tables 4 and 5). (Their original Tables 4-5 are reproduced in Appendix Tables A2-A3.) Despite finding no average effect, the authors do not frame their paper as contradicting the literature.2 Moreover, this paper is cited multiple times as supporting the meritocracy hypothesis.3
This is because the authors further test for an interaction between leader ability and age, reporting a positive interaction effect that is significant at the 5% level. To narrow in on this result, they test for a series of interactions with indicator variables for age being above a threshold (from 49 to 52), finding that the effect of leader ability on promotion is strongest for leaders older than 51. They conclude that leader ability matters for older politicians, because more years of experience produces a clearer signal of ability.
This result is consistent with a limited promotion tournament, where the Organization Department promotes older leaders based on their (lifetime) ability to boost growth (because older leaders have clearer signals of ability), but applies different promotion criteria to younger leaders (whose signals are too weak to detect). But this limited model contradicts the usual characterization of China’s promotion tournament as including all leaders, irrespective of age: in each province, leaders compete to boost GDP growth, and the winners (with the highest growth) are rewarded with promotion.
Moreover, half of all promotions occur for leaders younger than 51. If the Organization Department cannot measure ability for these young leaders, what criteria does it use to promote them? Furthermore, recall that the original motivation for the promotion tournament model was to explain China’s rapid growth. The incentives generated by this limited tournament are weaker, since the reward is only applied later in life; if young leaders are impatient, they will discount this future reward and hence put less effort into boosting growth. The limited tournament model thus has less explanatory power. Given these differences in interpretation, it is not clear why this paper has been cited without qualification as evidence for meritocratic promotion, when it supports only a limited promotion tournament.4
Besides these problems in interpretation, I also find issues in the paper’s empirical results. When estimating leader effects, the authors regress GDP growth on the three fixed effects as well as three covariates: initial city GDP per capita (by leader term), annual city population, and the annual provincial inflation rate. We might worry that small cities mechanically grow faster, since they start from a lower base. But since the model includes city effects, level differences in growth rates are not an issue. A second worry is that the variance of idiosyncratic shocks to growth is correlated with city size. Since growth shocks could affect promotion outcomes, it makes sense to control for initial GDP by term. However, it is not clear why population and inflation should be included. The authors mention that labor migration can drive GDP growth (p.413), but if leader ability affects growth through good policies that increase migration, then population is a mediator variable and should not be controlled for. The authors provide no justification for including inflation, which is odd because the dependent variable (real per capita GDP growth) is already expressed in real (rather than nominal) terms.
While the authors perform multiple robustness checks after they have estimated the leader effects, they do not apply robustness checks to the estimation of the leader effects itself. Given the lack of a strong justification for including population and inflation as covariates, I re-estimate the leader effects controlling only for initial GDP. Using these new leader effects, I then re-estimate their Table 4, which was directly replicated above. The results of my reanalysis are presented in Table 2.

While the average effect of leader effects (Column 1) is quite similar to the original (0.033 vs. 0.029), I find no statistically significant interaction effect with age (Column 2). The signs remain unchanged, but the magnitude of the coefficients drops by half, and the results are nonsignificant.5 Turning to the age threshold results (Columns 3-6), I find that the coefficient on \(\mbox{Leader effect} \times (\mbox{Age} > \mbox{Threshold})\) remains statistically significant only for the age 51 threshold, though at the 5% level instead of the original 1% (Column 5). These coefficients are smaller by one-third to one-half, compared to the original regressions.
I find similar results when reanalyzing the other specifications (LPM and ordered probit in both single- and multiple-equation models). My reanalyses are in Appendix Tables A8-A10, while Tables A3-A5 show the corresponding reproductions of the original results. The interaction effect with Age becomes nonsignificant, and out of the threshold interactions, only the age 51 threshold retains significance (at the 5% level).
Since dropping population and inflation when estimating leader effects seems like an innocuous change, I conclude that the reported interaction effect is not robust. This is an innovative, insightful, and well-written paper. However, the secondary results do not support a model of meritocratic promotion for prefecture leaders in China.
Li et al. (2019)
Li et al. (2019), published in the Economic Journal, studies GDP growth targets and promotion tournaments in China. They note that targets are higher at lower levels of the administration; for example, prefectures set higher targets than do provinces. Their explanation is that the number of jurisdictions competing in each promotion tournament is decreasing as one moves down the hierarchy, which increases the probability of a leader winning the tournament. As a consequence, leaders exert more effort, and higher-level governments can set higher growth targets while satisfying the leaders’ participation constraint.
As part of their model, they follow the literature and assume that promotion is meritocratic: performance (measured by GDP growth) increases the probability of promotion. Further, using data on prefecture mayors and secretaries over 2003-2014, they report an original result: the effect of performance on promotion is increasing in the growth target faced. That is, a one percentage-point increase in growth will increase a prefecture mayor’s probability of promotion by a larger amount when the provincial target is higher, relative to when the target is lower. So GDP growth has a larger weight in determining promotion when the growth target is higher.
This result seems naturally testable by interacting \(Growth \times Target\) in a panel regression using either a linear probability model or logistic regression, with a predicted positive coefficient on the interaction term. However, the authors report only results based on a structural model where promotion is determined by a contest success function. They do not mention logistic regression, and argue that linear regression is invalid: “Standard linear regression does not work here partly because promotion is determined by local officials’ own growth rates as well as by the growth rates of their competitors. The nonlinearity of the promotion function is another factor that invalidates the OLS estimation.” (p.2906)
But these do not seem to be problems for linear regression. First, as is standard in this literature, the promotion tournament can be captured by using prefecture growth rates relative to the annual provincial growth rate. Second, as mentioned above, we can test the growth target hypothesis by interacting \(Growth \times Target\) in a panel regression, where OLS estimation of a linear model is indeed valid. Given the lack of justification for omitting results from linear and logistic regression, I will test for an interaction effect between growth and the growth target using both a linear probability model and logistic regression.
First, I present the original Li et al. (2019) Table 5 results in Figure 1. This table shows MLE estimates of the following log-likelihood:
\[log L = \frac{1}{T} \sum_{i,t} (d_{it} log(p_{it}) + (1-d_{it})log(1-p_{it})).\]Here \(d_{it}\) is in indicator for promotion, and \(p_{it}\) is the promotion probability defined by:
\[p_{it} = \frac{g(y_{it},\bar{y}_{t},x_{it})}{\sum_{j} g(y_{jt},\bar{y}_{t},x_{jt})}.\]In this equation, \(g\) is a linear score function, \(y_{it}\) is leader \(i\)’s GDP growth rate, \(\bar{y}_{t}\) is the growth target set by the upper-level government, and \(x_{it}\) contains control variables. The score function has the form
\[g(y_{it},\bar{y}_{t},x_{it}) = 1 + \alpha_{1}y_{it} + \alpha_{2} \bar{y}_{t} + x_{it}\beta.\]The model in Li et al. (2019) assumes that \(\alpha_{1} >0\) and \(\alpha_{2}<0\), corresponding to the assumptions of meritocratic promotion and complementarity between growth targets and the responsiveness of promotion to GDP growth. As we can see from their results in Figure 1, the coefficient on GDP growth is positive, while the coefficient on the growth target faced is negative, whether using annual or cumulative growth.
Figure 1: Li et al. (2019), Table 5

Next, I reanalyze the Li et al. (2019) hypothesis using an interaction effect in a panel regression. To capture the idea that the effect of GDP growth on promotion is increasing in the growth target faced, I estimate the following model: \(Promotion_{ijpt} = \beta_{1} Growth_{ijpt} + \beta_{2} Growth_{ijpt} \times Target_{pt} + \lambda X_{ijpt} + \epsilon_{ijpt}.\) In this setup, the Li et al. (2019) assumptions are formulated as \(\beta_{1}>0\) (in a model without the interaction term) and \(\beta_{2}>0\): growth directly increases the probability of promotion, and the effect of growth on promotion is increasing in the growth target faced. To model relative performance, I use GDP growth relative to the annual provincial average.
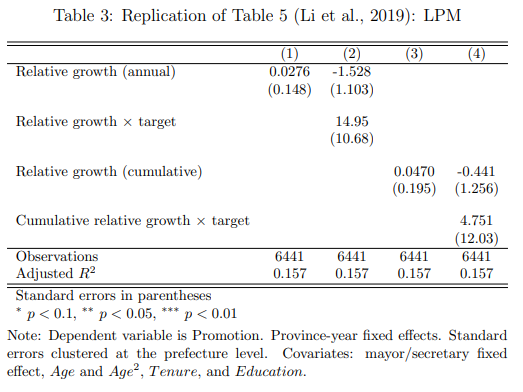
The estimates from the linear probability model are presented in Table 3, which replicates columns (1) and (3) in Table 5 of Li et al. (2019). First, I test the generic meritocracy hypothesis in the first and third columns, omitting the interaction term. I find that GDP growth does not have a statistically significant effect on promotion, either as annual or average cumulative growth. The second and fourth columns find positive interaction effects between realized growth and the growth target faced, but these are also nonsignificant.6 I find similar results when using logistic regression in Table 4. I again find a positive but nonsignificant average effect of growth on promotion. The interaction effect is positive and significant (at the 10%) level using annual growth data, but nonsignificant using cumulative data.7
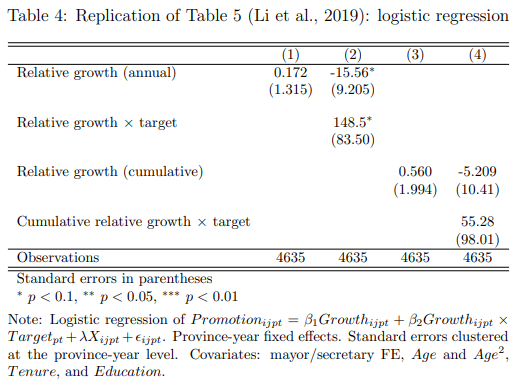
Hence, while the authors find that the corresponding results are statistically significant when using a structural model based on a contest success function, they are not robust to alternative specifications. A further worry is that the panel is unbalanced (due to missing data on growth targets). As shown in Appendix Figure A1, the sample size varies moderately from year to year, possibly leading to unrepresentative estimates. Moreover, the promotion data seems to have errors, with 0 promotions occuring in 2014. Li et al. (2019) is an interesting extension to the promotion literature with its analysis of GDP growth targets as a function of the number of contestants per promotion tournament. However, I provide evidence that the results for meritocratic promotion of prefecture leaders are not robust to using alternative regression models.
Chen and Kung (2019)
Chen and Kung (2019), published in the Quarterly Journal of Economics, studies land corruption in China, with secondary results on meritocratic promotion. The main result is that local politicians provide price discounts on land sales to firms connected to Politburo members, and these local politicians are in turn rewarded with promotion up the bureaucratic ladder.
For provincial leaders, they find a strong effect of land sales on promotion for secretaries, but not for governors. In contrast, annual GDP growth strongly predicts promotion for governors, but not secretaries. They conclude that “the governor has to rely on himself for promotion, specifically by improving economic performance or GDP growth in his jurisdiction [...] only the provincial party secretaries are being rewarded for their wheeling and dealing".
They find similar results at the prefecture level using data over 2004-2014: land deals predict promotion for secretaries, but not for mayors, while annual GDP growth predicts promotion for mayors, but not for secretaries. Overall, this supports the model of party secretaries being responsible for social policy, while governors (and mayors) are in charge of the economy, with performance on these tasks determining promotion.8 Thus, at both province and prefecture levels, government leaders (governors and mayors) compete in a promotion tournament based on GDP growth, while party secretaries do not.
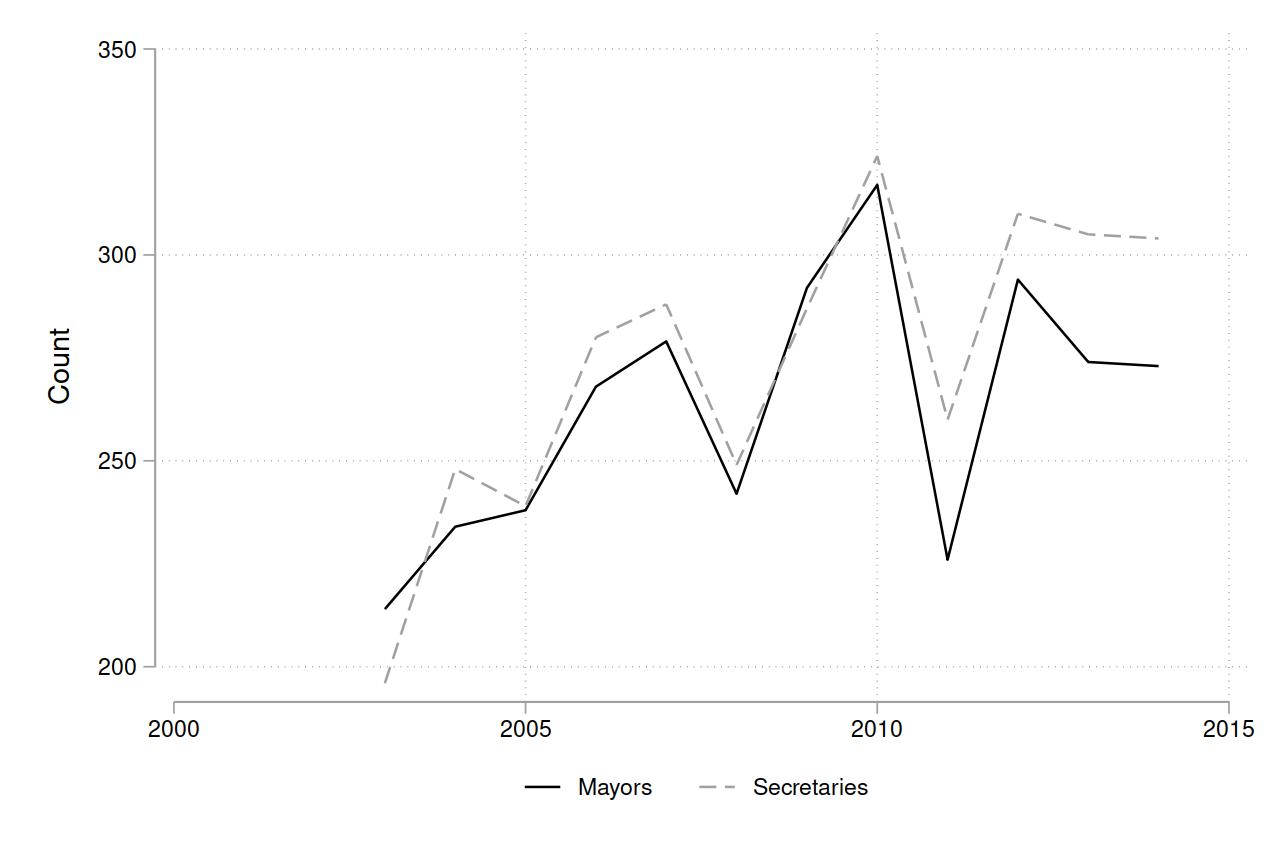
However, the Chen and Kung (2019) results for prefecture mayors should be interpreted with caution. In the literature, the annual promotion rate varies from 5 to 30% (peaking in Congress years), while the Chen and Kung (2019) data never exceeds 15% and has six years where the promotion rate is less than 2%. Figure 2 compares the annual promotion rate from Chen and Kung (2019) to the data from Wiebe (2020), Li et al. (2019), and Yao and Zhang (2015), where each paper uses a binary promotion variable. While the latter three sources broadly agree on the promotion rate, the Chen and Kung (2019) data is an outlier.
Figure 2: Promotion rates in the literature
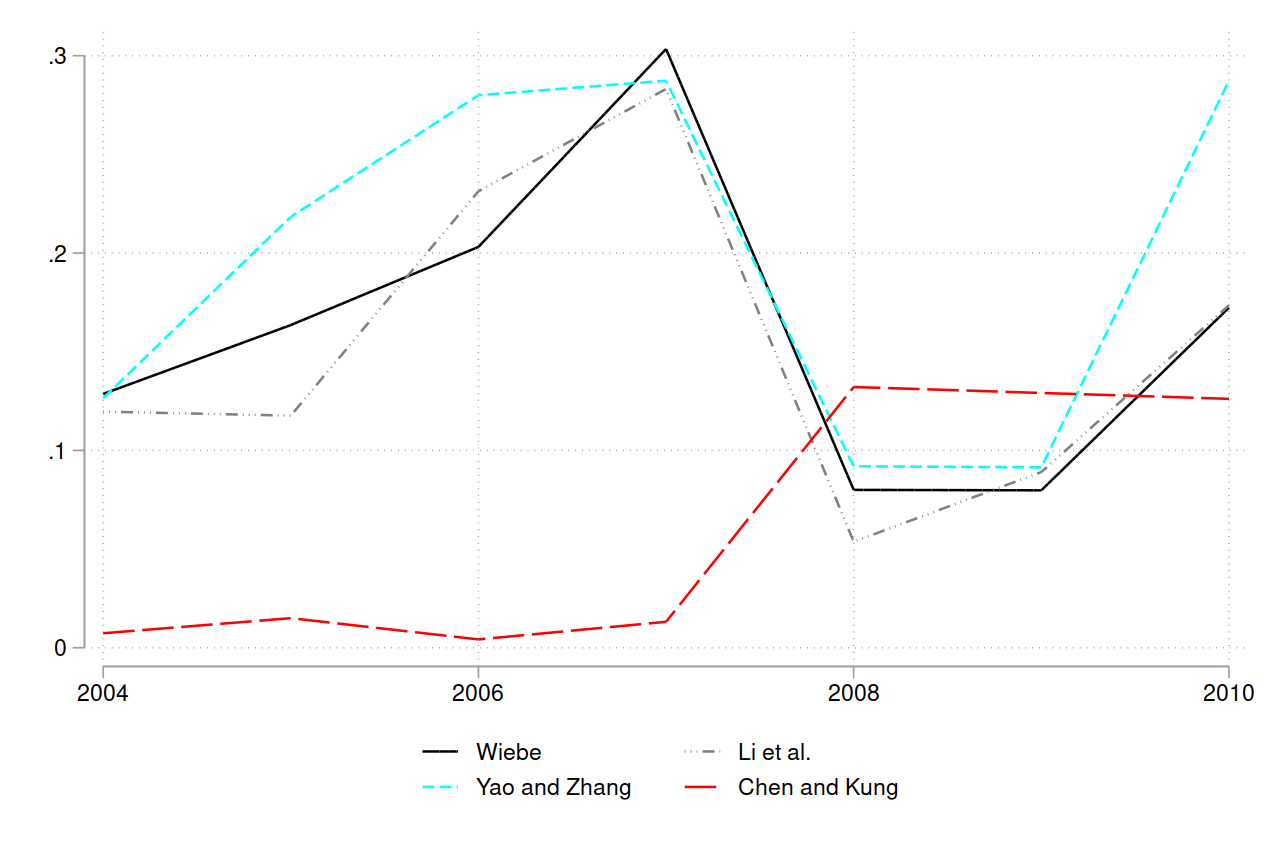 Note: annual promotion rate for prefecture mayors. Sample sizes differ across papers over 2004-2010. Wiebe
(2020): 2248 observations; Li et al. (2019): 1870 observations; Yao and Zhang (2015): 1220 observations;
Chen and Kung (2019): 2002 observations.
Note: annual promotion rate for prefecture mayors. Sample sizes differ across papers over 2004-2010. Wiebe
(2020): 2248 observations; Li et al. (2019): 1870 observations; Yao and Zhang (2015): 1220 observations;
Chen and Kung (2019): 2002 observations.
Neither the text nor the appendix in Chen and Kung (2019) discusses the data sources or specifically how the promotion variable was defined (e.g., what differentiates a demotion from a promotion). It is possible they used a stricter definition, for example, where a move from mayor to secretary is not counted as a promotion. This is consistent with the lower promotion rate, but is an unexplained departure from the literature, where promotion is defined to include a move to secretary.
Furthermore, upon investigating this discrepancy, I discovered apparent data errors in their promotion variable. The annual promotion variable is defined to be 1 in the year a mayor is promoted, and 0 otherwise. However, most promotions are from spells where Promotion=\(1\) multiple times. James Kung provided me with the raw mayor data, which I used to generate a corrected promotion variable (that equals 1 only in a mayor’s final year in office).9 Figure 3 shows the original and corrected data. Using data from Wiebe (2020), I also plot a strict definition where a move to secretary does not count as a promotion. The corrected variable roughly matches the scale of the strict definition, but is still different in every year.
Figure 3: Promotion rate: correcting and comparing
 Note: annual promotion rate for prefecture mayors.
The original Chen and Kung variable contains multiple promotions per term in office.
The corrected variable sets Promotion = 1 only in the final year in office.
The Wiebe (2020) strict variable is defined to exclude a move to secretary, including only moves to provincial
government.
Note: annual promotion rate for prefecture mayors.
The original Chen and Kung variable contains multiple promotions per term in office.
The corrected variable sets Promotion = 1 only in the final year in office.
The Wiebe (2020) strict variable is defined to exclude a move to secretary, including only moves to provincial
government.
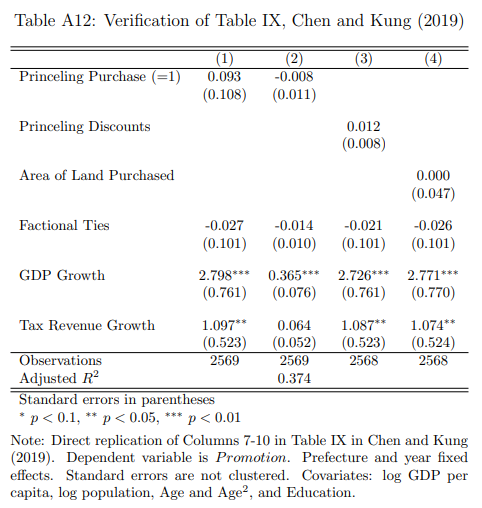
When I rerun the Table IX regressions using the corrected promotion variable, the results are surprisingly unchanged, given the difference in the dependent variable. Appendix Table A13 shows that the coefficient on GDP growth remains positive and statistically significant.10 To explore further, I re-estimate the effect of GDP growth on promotion using the promotion data from Yao and Zhang (2015), Li et al. (2019), and Wiebe (2020).11 To focus on the effect of GDP growth, I omit all politician-defined covariates and include only the prefecture covariates (tax revenue growth rate, log GDP per capita, and log population). This is to avoid issues stemming from possible disagreements over the identity of mayor \(i\) in prefecture \(p\) in year \(t\).12 I also cluster standard errors at the prefecture level, because the original paper did not cluster. Finally, I restrict the sample size to match the alternative datasets, which use different observations. The Li et al. (2019) and Wiebe (2020) datasets overlap fully with the original 2004-2014 sample, while Yao and Zhang (2015) overlaps over 2004-2010.
I estimate the following regression: \(y_{ijpt} = \beta \cdot Growth_{ijpt} + \delta X_{jpt} + \theta_{t} + \gamma_{j} + \epsilon_{ijpt}.\) The dependent variable is an ordered or dummy promotion variable for mayor \(i\) in prefecture \(j\) in province \(p\) and year \(t\), and prefecture covariates are included in \(X\). As in the original specification, I include year (\(\theta_{t}\)) and prefecture (\(\gamma_{j}\)) fixed effects.
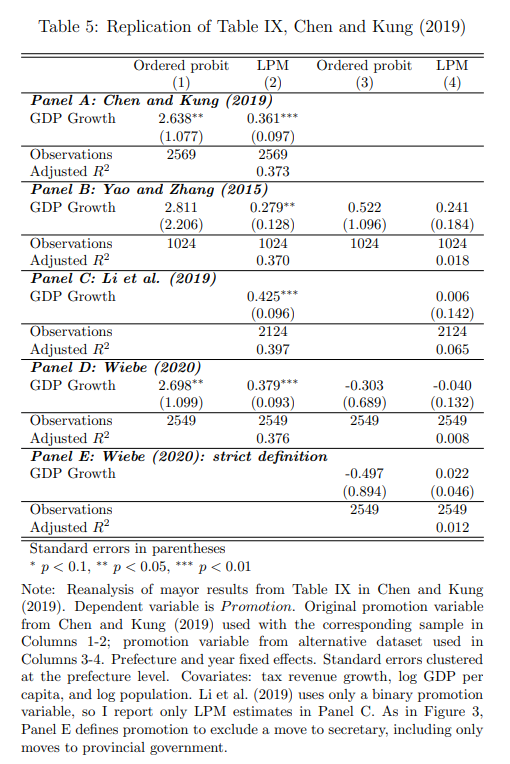
Table 5 replicates the ordered probit and LPM regressions using the alternative datasets, separated by panel. Panel A shows the results using the original promotion variable on the original sample. In the remaining panels, Columns 1-2 use the original Chen and Kung (2019) promotion variable restricted to match the sample in the corresponding alternative dataset. Despite the above changes in specification and sample, the results are broadly similar to those in the paper. For example, the original Chen and Kung (2019) LPM coefficient on GDP growth is 0.365 (0.076), while the coefficient using the new specification is 0.361 (0.097). In Panels B-D using alternative samples, the estimates are 0.279 (0.128), 0.425 (0.096), and 0.379 (0.093). Hence, the meritocratic effect reported in the original paper is not driven by politician covariates, small changes in the sample, or clustering standard errors.
To test whether the promotion variable is key to their results, I perform the same analysis using the alternative promotion data in Columns 3-4 of Table 5. I find that the coefficient on GDP growth is now nonsignificant for each alternative promotion variable. The LPM estimate using the Yao and Zhang (2015) promotion variable is similar in size to the original (Panel B, comparing columns 2 and 4); however, as noted above, the sample is much smaller, since Yao and Zhang (2015) does not have data for 2011-2014. The estimates using promotion data from Li et al. (2019) and Wiebe (2020) are very close to zero, and are based on more comparable sample sizes.
Since these alternative variables are likely using a more expansive definition, Panel E shows the results using the strict definition from Wiebe (2020), where a move to secretary is excluded. Despite having a similar scale for the promotion rate, the estimates are again nonsignificant.
Hence, it is unclear what support this paper provides for meritocratic promotion. Growth and promotion are correlated using the original promotion variable, but this variable differs from the rest of the literature and is not defined in the paper. Furthermore, this correlation does not hold using alternative variables from other papers, or using a strict definition that matches the lower scale of the original variable. While offering an astute analysis of land corruption, Chen and Kung (2019) does not provide verifiable evidence that prefecture mayors are promoted meritocratically on the basis of GDP growth.
Conclusion
I re-analyze three papers with secondary results on meritocratic promotion, and show that they do not provide robust evidence for the claim that prefecture leaders are promoted based on their performance in growing GDP. Across the three papers, the correlation between GDP growth and promotion is not robust to using alternative control variables, regression models, and promotion definitions. What lessons should we take away from this replication exercise? Generally, my results suggest that researchers need to conduct more robustness checks to produce reliable findings. More specifically, instead of separately collecting their own data, researchers studying meritocratic promotion should coordinate to create a centralized politician dataset with standardized definitions of promotion. A centralized dataset would help resolve disagreements over data (which politician was in office) and outcome variables (what counts as a promotion), thereby improving our understanding of the causes of Chinese economic growth.
Appendix


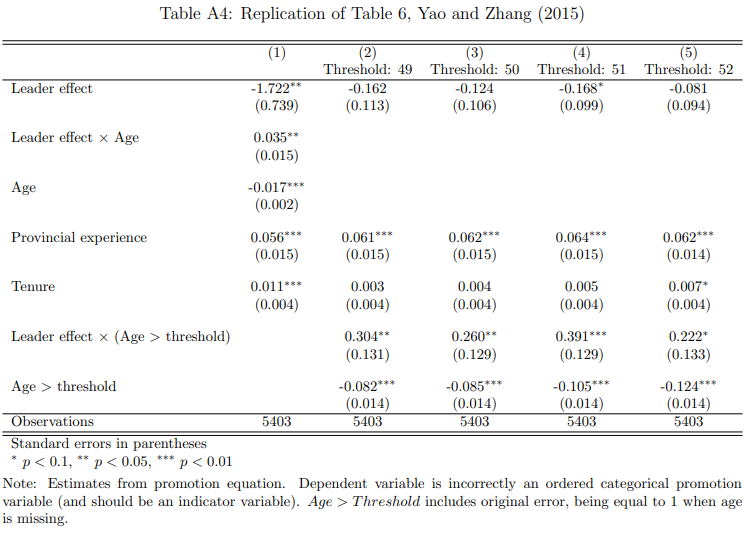


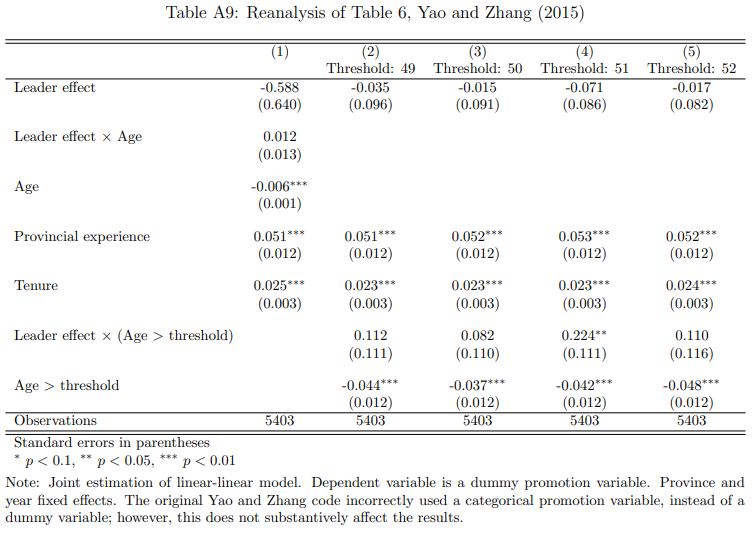
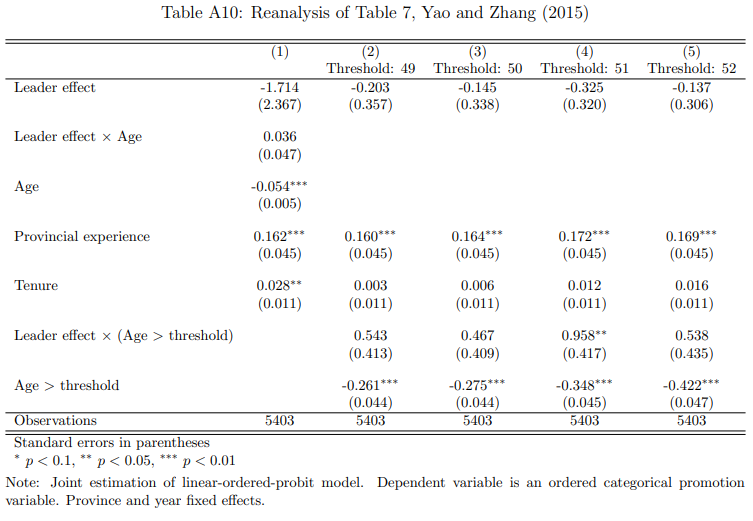

Figure A1: Sample size, Li et al. (2019)
 Note: There are 333 prefecture-level jurisdictions in China.

Footnotes
-
The Chinese administrative hierarchy has five nested levels: center, province, prefecture, county, and township. ↩
-
“We also improve on the existing literature on the promotion tournament in China. Using the leader effect estimated for a leader’s contribution to local growth as the predictor for his or her promotion, we refine the approach of earlier studies.” (Yao and Zhang 2015, p.430) ↩
-
Chen and Kung (2016): “those who are able to grow their local economies the fastest will be rewarded with promotion to higher levels within the Communist hierarchy [...] Empirical evidence has indeed shown a strong association between GDP growth and promotion ([...] Yao and Zhang, 2015)". Yao (2018): “Some studies have found that officials who perform better during their term of office are promoted more easily ([...] Yao and Zhang 2015)". Li et al. (2019): “the promotion of Chinese local officials is linked to economic growth in their jurisdictions. This strong linkage between the private interests of local officials and regional economic development thereby triggers an intensive tournament competition ([...] Yao and Zhang, 2015)." ↩
-
Wang et al. (2022) builds on the work of Yao and Zhang (2015) by extending the time series from 1998-2010 to 1994-2017 and including provincial politicians (note that Yang Yao is a coauthor on both papers). Despite using the same three-way fixed effects model to estimate leader ability, Wang et al. (2022) does not discuss Yao and Zhang (2015)’s focus on age or test for an interaction between ability and age. ↩
-
To investigate how the population and inflation controls affect the results, I re-run the analysis controlling for one variable at a time. When controlling for population (and initial GDP), the interaction effect with age is statistically significant at the 10% level (see Table A6). When controlling for inflation (and initial GDP), the interaction effect is nonsignificant (see Table A7). Hence, the change in results seems to be driven more by the population variable. ↩
-
Note that the growth target (set by the provicial government for prefecture leaders to achieve) varies at the province-year level, and hence is collinear with the province-year fixed effect. In unreported results, I include separate province and year fixed effects (instead of province-year fixed effects), and find similar nonsignificance. ↩
-
Appendix Table A11 shows the results using cumulative absolute growth (instead of relative to the provincial average), corresponding to Columns 3-4 of Tables 3 and 4. The estimates are nonsignificant. Note that the results using annual growth are identical when using relative or absolute growth, since I am including a province-year fixed effect, which is collinear with provincial average growth. ↩
-
Jia (2017) makes a similar point: “[Provincial secretaries’] major responsibilities include the implementation of the central government policies and social stability whereas governors’ key duty is to promote growth.” p.12 fn.15 ↩
-
An alternative explanation suggested by a referee is that mayors are promoted by half of a bureaucratic rank to a new position, while also continuing to serve as mayor. This would be a departure from the literature, where promotions are defined as moving up at least one full rank. Moreover, the same problem occurs with the categorical turnover variable, with a mayor being demoted or retiring multiple times during a spell. Since the authors do not discuss how the promotion and turnover variables are defined, we cannot draw firm conclusions. ↩
-
I provide a direct replication of Table IX in Appendix Table A12, where I perfectly reproduce the results in the original paper. ↩
-
Table IX estimates the effect of land sales, political connections, and GDP growth on promotion for prefecture mayors over 2004-2014. However, there are some discrepancies between the published table and the replication code. First, the table reports using data from 2004-2016, but the replication files only include data over 2004-2014. Second, while the authors report using robust standard errors, this is not implemented in the replication code. Third, the table reports using province fixed effects, but the replication code actually uses prefecture fixed effects. ↩
-
For example, if the alternative data has mayor A in office, while the Chen and Kung (2019) data records mayor B, then the age, education, and political connection variables will disagree. ↩
 Michael Wiebe
— built with Jekyll using Lagom theme
Michael Wiebe
— built with Jekyll using Lagom theme