Can we detect the effects of racial violence on patenting? Replicating Cook (2014)
A year ago, I wrote a short post looking at the data in Cook (2014) (sci-hub) (replication files) on the effect of racial violence on African American patents over 1870-1940. I discovered that the state-level panel data was strikingly imbalanced. With Lisa Cook in the news for being nominated to the Federal Reserve Board of Governors, I decided to revisit the paper more thoroughly. I find that the main time series result is not robust, and provide evidence that the panel data results are too noisy to be trusted.
Time series regressions
Cook has two measures of patents per year: (1) using the year the patent was applied for, and (2) using the year the patent was granted. In the paper, Figure 1 reports Black (and white) patents per million using grant year, while Figure 2 shows Black patents per million using application year. Comparing the two graphs, we immediately see that the scale differs by a factor of about 10. Here I merge the two datasets and plot the application-year and grant-year variables on the same graph.
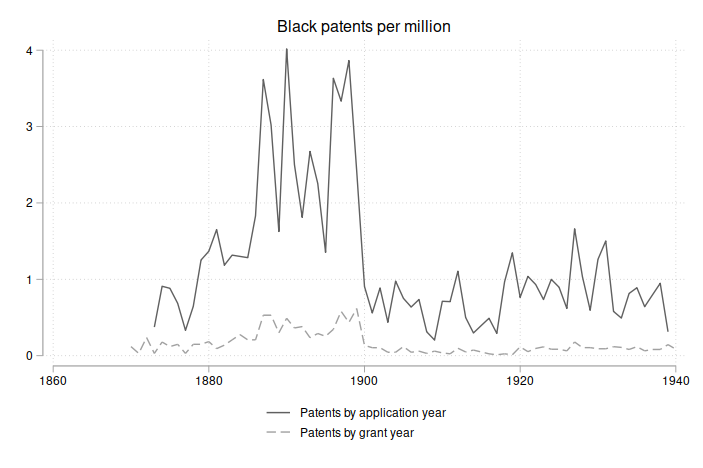
There is a huge discrepancy between the two patent variables. Cook collected data on 726 patents over 1870-1940, but the average by grant-year is 0.16, while the average by application-year is 1.22.1 2
Cook’s replication data does not include the raw patent or population variables, so we can’t say for sure what’s going on here. But the average Black population (see Table 1) was roughly 10 million, and 0.16 grant-year patents/M * 10M * 71 years = 114, far fewer than the 726 patents recorded. In contrast, 1.22 application-year patents/M * 10M * 71 years = 866, which is in the ballpark of 726. Speculating, one possible explanation is that Cook calculated grant-year patents using the white population (average 75 million) in the denominator, giving 0.16 * 75 * 71 = 852 patents.3 Hopefully Cook will publish the raw data and we can resolve this.
In any case, the grant-year patent variable seems clearly flawed, while the application-year variable looks correct. Since the Table 6 results use the grant-year patent variable, we should run a robustness check using the application-year variable.
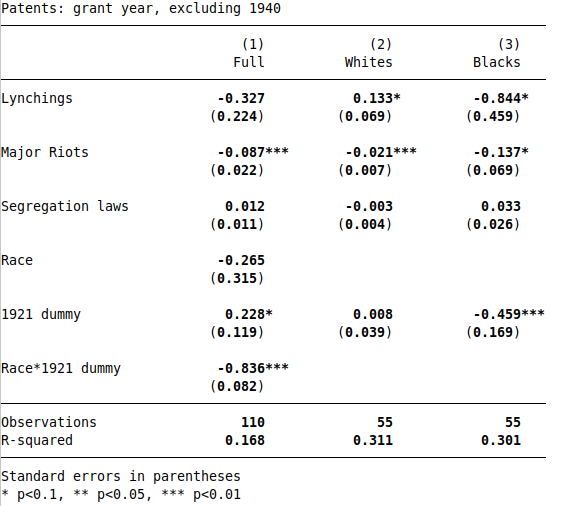
Table 6 uses time series data to estimate the effect of lynchings, riots, and segregations laws on patents. Column 1 uses race-year panel data, where the lynching and patent variables vary by race (but the riot and segregation law variables vary only by time). Columns 2 and 3 run time series regressions separately by race, allowing us to estimate differential effects of racial violence on patenting.
I am able to reproduce Table 64, using grant-year patents:
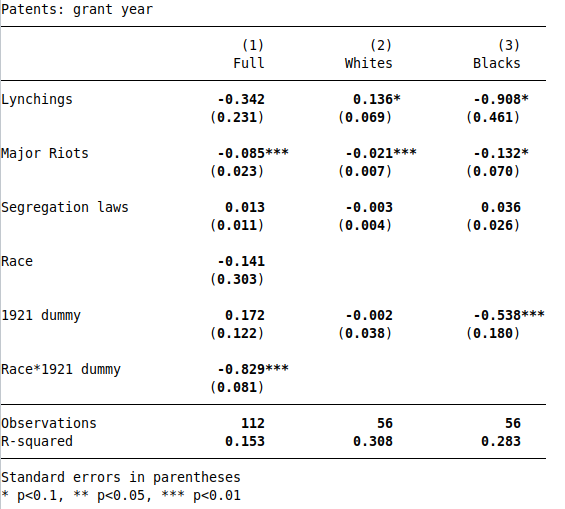
As noted in the paper, lynchings and riots have negative effects on Black patenting, and the 1921 dummy has a large negative effect, corresponding to the Tulsa Race Riot.
For the robustness check, I redo Table 6 using application-year patents instead of grant-year patents. This specification actually seems more appropriate, since Cook’s mechanism is that racial violence deters innovation by Black inventors; so racial violence would first impact patent applications, and with a lag impact granted patents. So the effects should be stronger using the application-year variable.
The application-year variable is missing in 1940, which reduces the sample size for the robustness check by 1. To make a pure comparison, I re-run the grant-year regressions dropping 1940, and get similar results (see footnote5). Next, I run Table 6 using application-year patents:
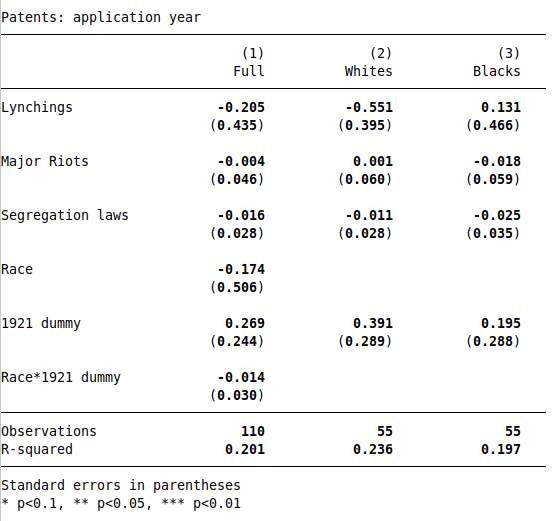
The results are dramatically different: the negative effect of lynchings and riots disappears, as does the negative effect in 1921. If the grant-year patent variable is incorrect and the application-year variable is correct, then the paper’s main result is wrong.
Panel data regressions
In Tables 7 and 8, Cook uses state-level panel data over 1870-1940 to run regressions of patents on lynching rates, riots, and segregation laws. However, we can immediately see a problem: there are 49 states and 71 years in the data, but only N=430 observations. A complete, balanced panel would have 3210 observations, as the number of states grows from 38 in 1870 to 49 in 1940 (including DC; see code for details). So Cook is using 430/3210 = 13% of the full sample.
And the pattern of missing data is not random.
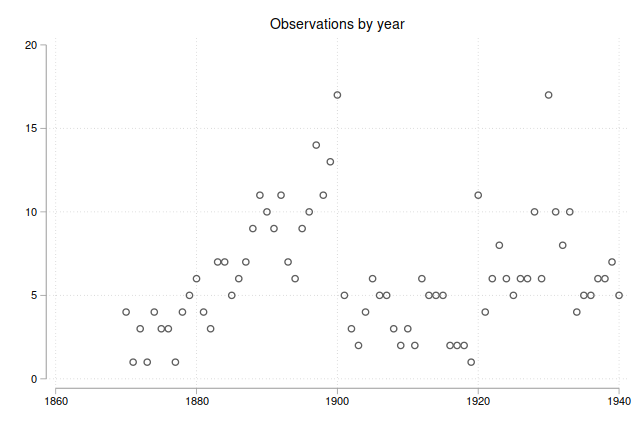
Below I plot the number of observations by state and year.
First, we see that the majority of states have fewer than 10 observations over 71 years.
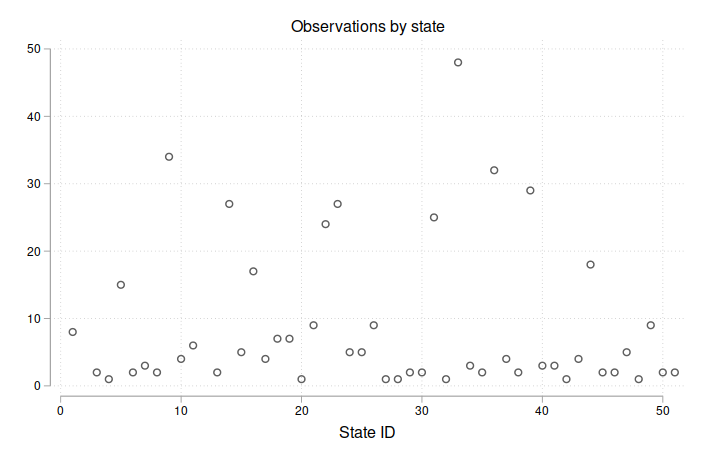
Next, the sample size is increasing up to 1900 before dropping off and rising again starting in 1920.
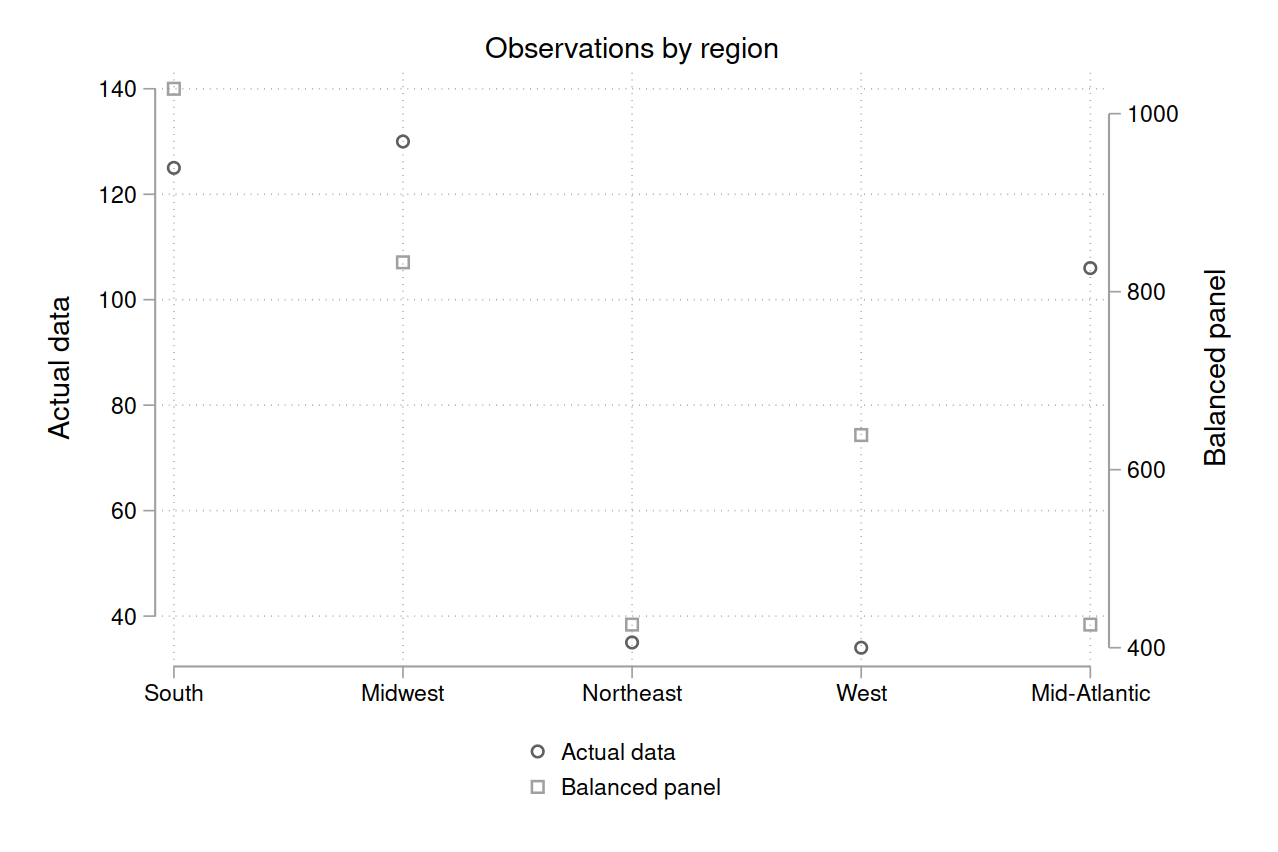
Decomposing by region, we see that the Midwest and Mid-Atlantic regions are relatively overrepresented, while the South and West are relatively underrepresented.6
Moreover, consider how this imbalanced panel compares to the full time series. There are 726 patents in the time series, and 702 in the panel data (for 97% coverage). But the violence variables are drastically under-reported: there are 35 riots in the time series data, but only 5 in the panel data (14%). Similarly, there are 290 new segregation laws in the time series data, but only 19 in the panel data (7%).7 (The same problem applies with lynchings, but the replication files don’t have count data, so we can’t quantify it.)
What explains the missing data? It appears that Cook dropped any state-year observation that had a variable with a missing value. The resulting dataset has no variables with missing values, but a lot of missing state-year observations, and hence a severely imbalanced panel.
With this low level of data coverage, I’m skeptical of the panel data results in Tables 7 and 8. It’s possible that these results are unbiased, and would remain stable as the missing data was filled in (through a law of large numbers argument). Especially considering the prior plausibility that racial violence and patents are negatively correlated, we should place some weight on this.
But it’s also possible that they’re false positives. And statistically significant results are easy to get when you’re working with small effects and noisy data. For example, let’s check for heterogeneous effects by region; a robust result should be stable across different cuts of the data. From Table 7, I run the Column 1 regression separately for each region:
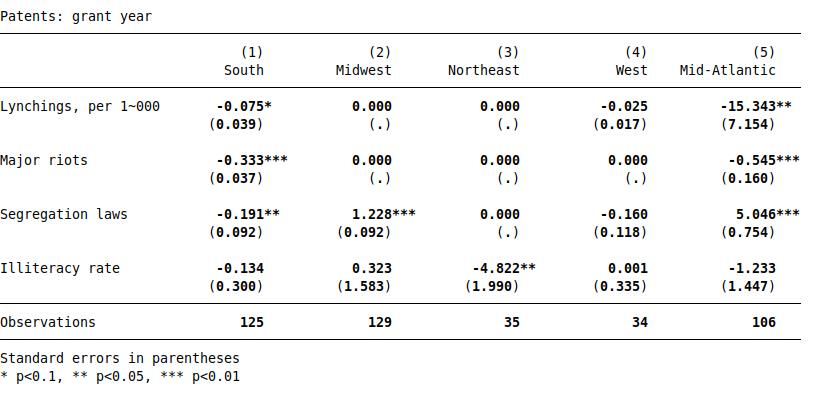
The lynchings estimate for the South (-0.075) is similar to the average effect from the full sample (-0.058). But there’s no estimate at all for the Midwest and Northeast, since there were zero lynchings in those regions. The estimate for the Mid-Atlantic is huge with two stars, 200x bigger than the South estimate. But this is almost certainly a Type M error (an overestimate of the true effect), as the lynching rate for the Mid-Atlantic is 3% of the average.
With only 5 riots in the dataset, it’s no surprise that there’s no estimate for the Midwest, Northeast, or West regions (which had zero riots in this data). The effect size is somewhat similar for the South and Mid-Atlantic, perhaps indicating a more homogeneous effect of riots on patenting.
For segregation laws, the Table 7, Column 1 estimate is -0.1. The effects for the South and West are in the ballpark, at -0.19 and -0.16. But the effects for the Midwest and Mid-Atlantic are positive, massive, and have three stars! But statistical significance doesn’t mean anything here, because the data is noisy. There are 19.33 new segregation laws in the data, with 17 in the South, 1 in the Midwest, 1 in the West, and 0.33 in the Mid-Atlantic (presumably a data error).
Another way to assess noisy data is to decompose the patenting variable by economic category. In fact, Cook does this in Table 8, running separate regressions for assigned patents (e.g., the patentee sells their patent to a firm), mechanical patents, and electrical patents (note that mechanical and electrical patents can be assigned or not).8
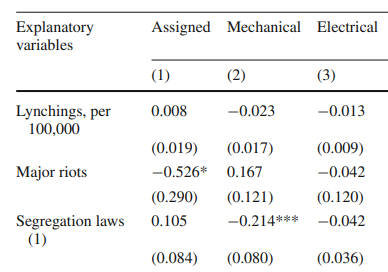
(For comparison, the Table 7, column 1 estimates are: lynchings -0.058***, riots -0.429***, segregation laws -0.1.) The lynching estimates are much smaller than in Table 7, and none are statistically significant.9 The riot estimates have the same sign and similar magnitude only for assigned patents. For segregation laws, the coefficient has the opposite sign for assigned, double the magnitude for mechanical, and half the magnitude for electrical patents. Overall, there is strong heterogeneity in the effects of racial violence, and Cook does not provide a theory to predict the pattern of varying estimates. This heterogeneity is more consistent with noise than a clear causal effect.
My takeaway from these subsample results is that the missing data is causing low statistical power, and we’re seeing Type S and Type M errors. Hence, we shouldn’t place much weight on the correlations in Tables 7 and 8, since they would probably change considerably if we had a complete and balanced panel.
Conclusion
To summarize, the main time series result in Cook (2014) is not robust to using an alternative patent variable, and the panel data results are questionable because of missing data. Nonetheless, the conclusions remain plausible, because they have a high prior probability. Lynchings, race riots, and segregation laws were a severe problem, and it would be astonishing if they didn’t have pervasive effects on the lives of Black people.
But with the data available, it’s unrealistic to think we can statistically detect causal effects. Credible causal inference would require more complete data as well as an identification strategy more convincing than a panel regression (not to mention modelling temporal and spatial spillovers). Descriptive analysis is the most that this dataset can support, and is a valuable contribution in itself, along with the rich qualitative evidence in the paper.
Cook deserves credit for pursuing this important research question and putting in years of effort to collect the patent data. And in fact, recent research, no doubt inspired by Cook, does find that segregation (of the federal government by Woodrow Wilson) and riots (specifically, the Tulsa Race Massacre) had substantial negative effects on Black Americans. I hope that more researchers continue in Cook’s footsteps and bring attention to the consequences of America’s racist history.
In terms of computational reproducibility, Cook’s code has several problems:
- The code for Figures 1, 2, and 3 is in Stata graph editor format, which cannot be run from a do-file.
- Figure 1 uses the variable
patgrntpc, patents by grant-year per capita, but the graph refers to patents per million. Similarly, Table 5 reports ‘Patents, per million’, but the code usespatgrntpc. The variable should be named ‘patents by grant-year per million’. - There’s no code for Table 4.
- Equation 1 and Table 6 refer to patents per capita, but the variable in the code,
patgrntpc, has mean values of 0.16 for Blacks and 425 for whites; this is patents per million, not per capita. - The code for Table 6 refers to a variable
LMRindex, but the dataset containsDLMRindex. - Section 3.2 mentions that the state-level regressions use data over 1882-1940, but the code uses data over 1870-1940.
- The code for Table 7 includes a command to collapse the data down to the state-year level, but the data is already in a state-year panel.
- The code for Table 7 includes a variable,
estbnumpc, for the number of firms per capita, but it is not included in the dataset. - The code for Column 1 in Table 7 includes the ‘number of firms’ variable, but the paper only includes it in columns 3-6.
- In the notes to Tables 7 and 8, Cook writes that “Standard errors robust to clustering on state and year are in parentheses.” However, the code only clusters by state, using
vce(cl stateno). - The code for Table 8 has an error in its clustering command, using the incorrect syntax
vce(stateno)instead of the correctvce(cl stateno). - The code for Table 8 does not exactly reproduce the results in the paper. When I run the code, I get N=429, while Cook’s regressions have N=428. It’s possible that Cook is controlling for firms per capita, as in Table 7, but this variable is not included in the code, and is not mentioned in the table.
- The code for Table 9 does not reproduce the results in the paper.
There are also a few data errors:
- State 9 has the South dummy equal to 1 for all years, but also has the Mid-Atlantic dummy equal to 0.33 in 1888.
- State 14 has the Midwest dummy equal to 1 in all years except 1886, when both it and the South dummy are 0.5.
- State 31 in 1909 has a value of 0.333333 for ‘number of new segregation laws’, which should be integer-valued.
Footnotes
See here for code.
-
Cook notes that “a comparison of a sample of similar patents obtained by white and African American inventors shows that the time between patent application and grant for the two groups was not significantly different, 1.4 years in each case.” (p.226, fn. 15) Also, there is no application-year patent data for 1870-72. ↩
-
This discrepancy becomes even more puzzling when we compare the paper and the code:
- Figure 1 reports patents per million by grant year, but uses a variable named
patgrntpcwith the label ‘Patents by grant year’. The ‘pc’ would seem to indicate patents per capita. - Figure 2 reports patents per million by application year, using a variable
pat_appyear_pm, with ‘pm’ corresponding to ‘per million’. - Table 5 presents descriptive statistics, with a ‘Patents, per million’ variable with a mean of 0.16, but the code uses
patgrntpc. - Equation 1 and Table 6 both refer to patents per capita. The code for Table 6 uses the logarithm of
patgrntpc.
Although the variable
patgrntpcwould seem to be ‘Patents by grant year, per capita’, this can’t be true: the average value is 0.16 for Blacks, and 425 for whites. These values are clearly measured per million. So the variable must be misnamed, and actually represents patents per million, as described in Figure 1 and Table 5. This means that Equation 1 and Table 6 are mistaken: the dependent variable is log patents per million, and not log patents per capita. ↩ - Figure 1 reports patents per million by grant year, but uses a variable named
-
Another explanation is that the application-year variable counts all patents that were applied for, including patents that were denied. This is not consistent with the text, where Cook only mentions 726 granted patents. In footnote 15, Cook writes that analyzing “[a]pplication rejection rates […] is beyond the scope of the current paper.” Moreover, even if true, this explanation doesn’t account for why the grant-year variable does not add up to 726. ↩
-
Cook’s Table 6 incorrectly shows the lynching estimates in Columns 2 and 3 as having p-values less than 0.05. ↩
-
Note that N = 110 and 55 instead of 112 and 56.
-
Number of states by region: South 15, Midwest 12, Northeast 6, West 12, Mid-Atlantic 7. Eleven states enter after 1870, and hence have fewer than 71 years in the complete panel. See code for details. ↩
-
The actual number is 19.33. Somehow, one state-year observation has a value of 0.33 for the number of new segregation laws. ↩
-
In Column 4, Cook runs a regression using Southern patents as the dependent variable. That is, while still using the full panel, the patent variable is set to 0 for non-Southern states. This is an incorrect approach for estimating heterogeneous effects. A correct approach would restrict the sample to Southern states, as I did above, or use the full sample and interact the violence variables with a South dummy. ↩
-
Cook mentions in footnote 49 that lynchings have a negative effect on ‘miscellaneous patents’, but this is not reported in the table, and the variable is not included in the dataset. ↩
 Michael Wiebe
— built with Jekyll using Lagom theme
Michael Wiebe
— built with Jekyll using Lagom theme