Notes on the new measles literature
There are a handful of papers applying the ‘disease burden’ method to study the long-term effects of the measles vaccine. This method uses cross-sectional pre-treatment disease incidence interacted with a time series variable for vaccine access. This works for diseases like hookworm and malaria, which have geographic variation in climatic suitability for the parasites that cause disease. But, as I discuss in my comment on Atwood (2022), measles is extremely contagious, so everyone gets infected, and there is no long-run geographic variation in incidence. The disease burden method cannot be applied straightforwardly to measles. It would be enlightening to see a big picture analysis of which diseases this method can be used on.
Atwood (2022) studies the long-term effects of the measles vaccine on employment and income. Barteska et al. (2023) uses a similar approach for the effects on education. Both papers find positive effects, which makes a consistent story about the mechanism: contracting measles causes children to miss school, which reduces human capital, which reduces adult income. So the vaccine increases education, which increases adult income and employment.
One difference between these papers is that Atwood uses 1964 as the treatment year (the vaccine was introduced in 1963, so this should be 1963), while Barteska et al. emphasize that vaccine takeup was low until the 1967-68 immunization campaign. So in a sense, these papers are contradictory: if Atwood finds a treatment effect in 1964, then there are pre-trends in Barteska et al.’s specification. Atwood calculates measles incidence over 1952-63, while Barteska et al. use 1963-66, so the treatment groups could be different.
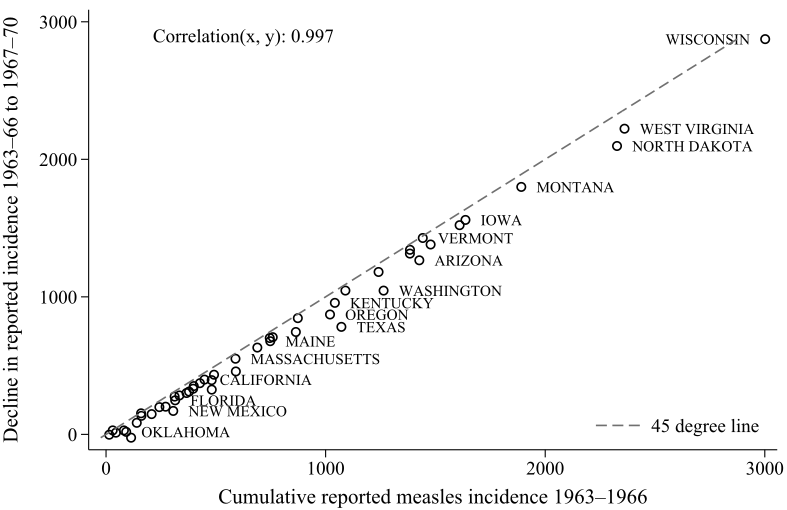
Both Atwood and Barteska et al. have a graph showing the decline in reported measles incidence after the vaccine.

This is taken as evidence that measles incidence declined more in the high-measles states. But this is also consistent with actual incidence being the same across states, and reporting capacity being different. Since measles was eradicated to 0, each state’s reported incidence will be reduced by ~100%. So this graph is also consistent with the story that there is no geographic variation in actual measles incidence.
In my comment on Atwood (2022), I ran an event study and found post-vaccine trends: the treatment effect is increasing for cohorts born after the vaccine, which doesn’t make sense, since there’s no variation in the treatment dose (vaccine access). Barteska et al. (2023) does run an event study, and doesn’t find the same post-vaccine trends. My event study, following Atwood, used a 16-year treatment window over 1949-1964, with comparison windows 1932-1948 and 1965-1980. Barteska et al. use an 8-year window over 1959-1966, with comparison windows 1950-1958 and 1967-1975. Note that in the Barteska et al. event study, the coefficients start increasing 8 years before the immunization campaign. In my event study for Atwood, the coefficients start increasing 16 years before the vaccine. If Barteska et al. are right that the vaccine was targeted towards younger children, then the treatment effect for ages 9-16 (at vaccine introduction) is not consistent with a vaccine effect.
What treatment variation is Barteska et al. using, if there’s no long-run geographic variation in actual incidence? Since they use a shorter window for calculating measles incidence (1963-66), it’s possible they are measuring differences in short-run incidence, based on differences in epidemic cycle timing. In contrast, Atwood calculates average measles incidence over 12 years, which would average out differences in cycle timing. So Barteska et al. could be capturing variation in the susceptible population; i.e., children who avoid measles and the negative effects of disease, and get vaccine-induced immunity instead of virus-induced immunity.
Chuard et al. (2022) extends this reasoning to explicitly capture variation in the susceptible population. They use an epidemiological SIR model to directly measure geographic variation in actual cases before the vaccine. This method should work for evaluating the long-term effects of the measles vaccine, since cohorts with low incidence get vaccinated and avoid disease, increasing their education and adult income. But they find no effects, while a model using pre-vaccine measles mortality finds effects similar to Atwood. They note that Atwood is using a different source of variation compared to the epidemiological model, but it’s still not clear exactly what that is: what is the difference between High- and Low-measles states?
Given the similarity between their results and Atwood’s, they conclude that Atwood’s variation (reported incidence) is a proxy for disease severity. But this treatment variation is ambiguous, because disease severity can be affected by worse viral outbreaks (e.g., getting a worse case of measles from a higher viral dose), initial health levels (the same viral dose causes worse disease in sick people), or health infrastructure (the same viral dose causes worse disease when health care is poor). The concept of ‘disease burden’ doesn’t seem to apply for a universal disease like measles. They also don’t discuss differences in health infrastructure leading to different reporting rates.
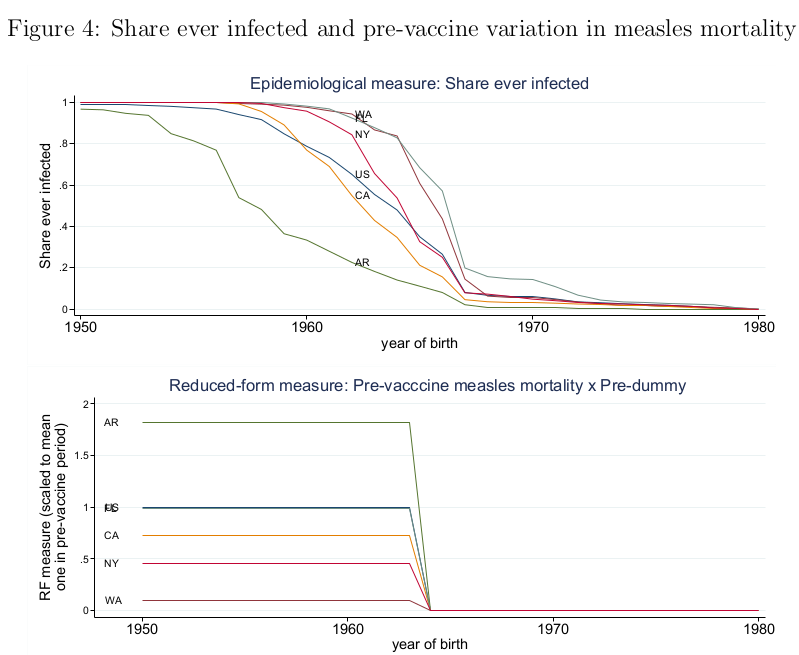
Moreover, if the results using mortality and incidence are similar, then presumably the pre-vaccine state averages should be correlated. They do not report this correlation. But Figure 4 shows share ever-infected and mortality for a sample of five states, and the correlation is negative:

WA has the highest share ever-infected and the lowest mortality, while AR has the lowest share ever-infected and the highest mortality. Also, if incidence is a proxy for disease severity, then it should be correlated with worse health outcomes.
Chuard et al. also make a few odd choices in research design. Like Atwood, they don’t run an event study to test for pre- or post-trends. They say (footnote 5) that they calculate birthyear using age and survey year, even though IPUMS has a birthyear variable. They also aggregate the data to the state-of-birth X year-of-birth X age level, instead of using the micro data and clustering standard errors.
There are several other papers on measles vaccines. Atwood and Pearlman (2023) does the same exercise as Atwood (2022), but for the 1973 vaccine in Mexico. This also faces the problem of long-run average incidence being ambiguous treatment variation. Noghanibehambari (2023) copies Atwood (2022), with birth outcomes as the dependent variable. Berg et al. (2023) studies the UK measles vaccine using the same identification strategy as Atwood, and finds no average effect on height or education.
